MURICO.com Forum
5 days down today, I would think we would get a bounce here. Array says otherwise.
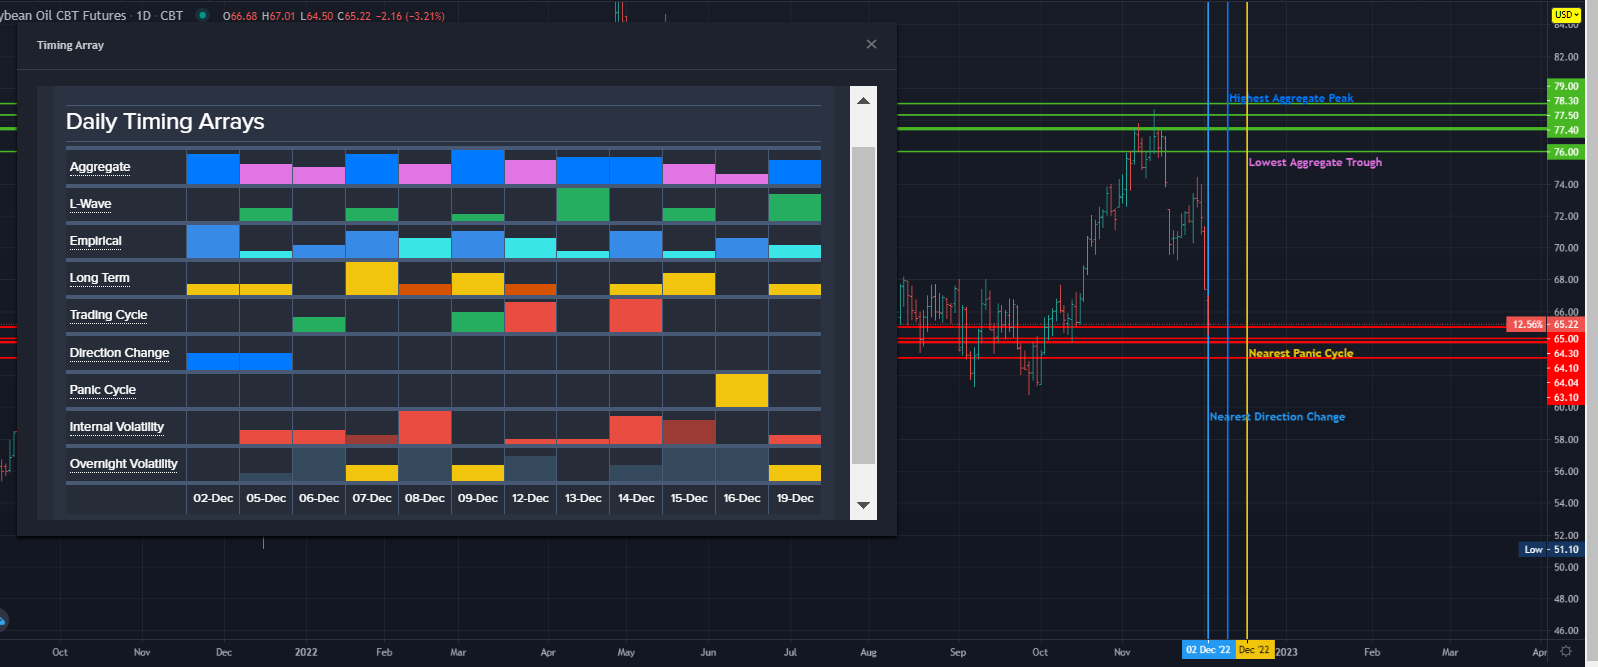
Chart Text - Daily
The Soybean Oil CBT Futures made a new low today which has been a decline over the past three trading days. However, we have elected one Bearish Reversal implying that
we should move down for the next trading session. Nevertheless, this market has not yet breached our underlying system support levels. Interestingly, this market opened
below the previous low making a new low down 4.27% under the previous low and then closed below that the previous low plunging significantly in panic mode for the second
consecutive time by 9.54% from the previous session's high. This does warn that this market is in crash mode position right now. A break of today's low of 6450 during the next
trading session will warn of a potentially serious decline ahead especially if it closes below today's low again. The last important high was formed on Friday November 11th at
7864 which was 15 trading days ago. Our projected support for tomorrow lies at 6398 and a break of that level can set in motion a continued panic to the downside where
extreme support lies at 6118. Hence, pay close attention at this time.
During the last session, we did close above the previous session's Intraday Crash Mode support indicator which was 6720 settling at 6738. The current Crash Mode support for
this session was 6384 which we closed above at this time. The Intraday Crash indicator for the next session will be 6118. Up to now, the market has been holding above this
Crash Mode indicator in the current trading session, but it is still declining sharply. Granted, it is also moving lower for the next session. A consolidation would only be
suggested by opening above this target, and holding this session's low of 6450 intraday. However, a break of this session's low followed by a closing below this level as well
will warn that a continued sharp decline is still in motion. The Secondary Intraday Crash Mode support lies at 6056 which we are trading above at this time. A breach of this
level with a closing below will signal a sharp decline is possible.
Intraday Projected Crash Mode Points
Today...... 6384
Previous... 6720
Tomorrow... 6118
This market has declined for 3 trading days which has been a sharp decline of 13%. In the process, we have elected four Daily Bearish Reversals. Don't forget that a Daily
Bearish only indicates a lower low in the next trading session. The Forecast Array suggests possible days for lows.
Our projected pivot point remains as resistance standing at 6716. Only getting above this level on a sustained closing basis will signal a rally to the upside.
Presently, the market remains bearish on the short-term levels of our indicators while the long-term trend and cyclical strength are bearish. The current Daily Breakline rests
at 6356. A penetration of that level intraday can lead to a sharp panic type decline if sustained. This market has technically broken through the bottom of our projected
envelope of support at 6564 warning this decline has been rather reasonable down 13% from the high made 11/29. We have elected all four Bearish Reversals from that high
showing weakness.
The Projected Breakout Resistance indicator resides at 6677 which we are already exceeded intraday but the market closed below it as of this session's closing at 6522 Still,
this typically implies that this market will rally to test overhead resistance if we exceed that level again intraday.
Intraday Projected Breakout Resistance
Today...... 7157
Previous... 7467
Tomorrow... 6677
NEXT OPEN COMMENT