MURICO.com Forum
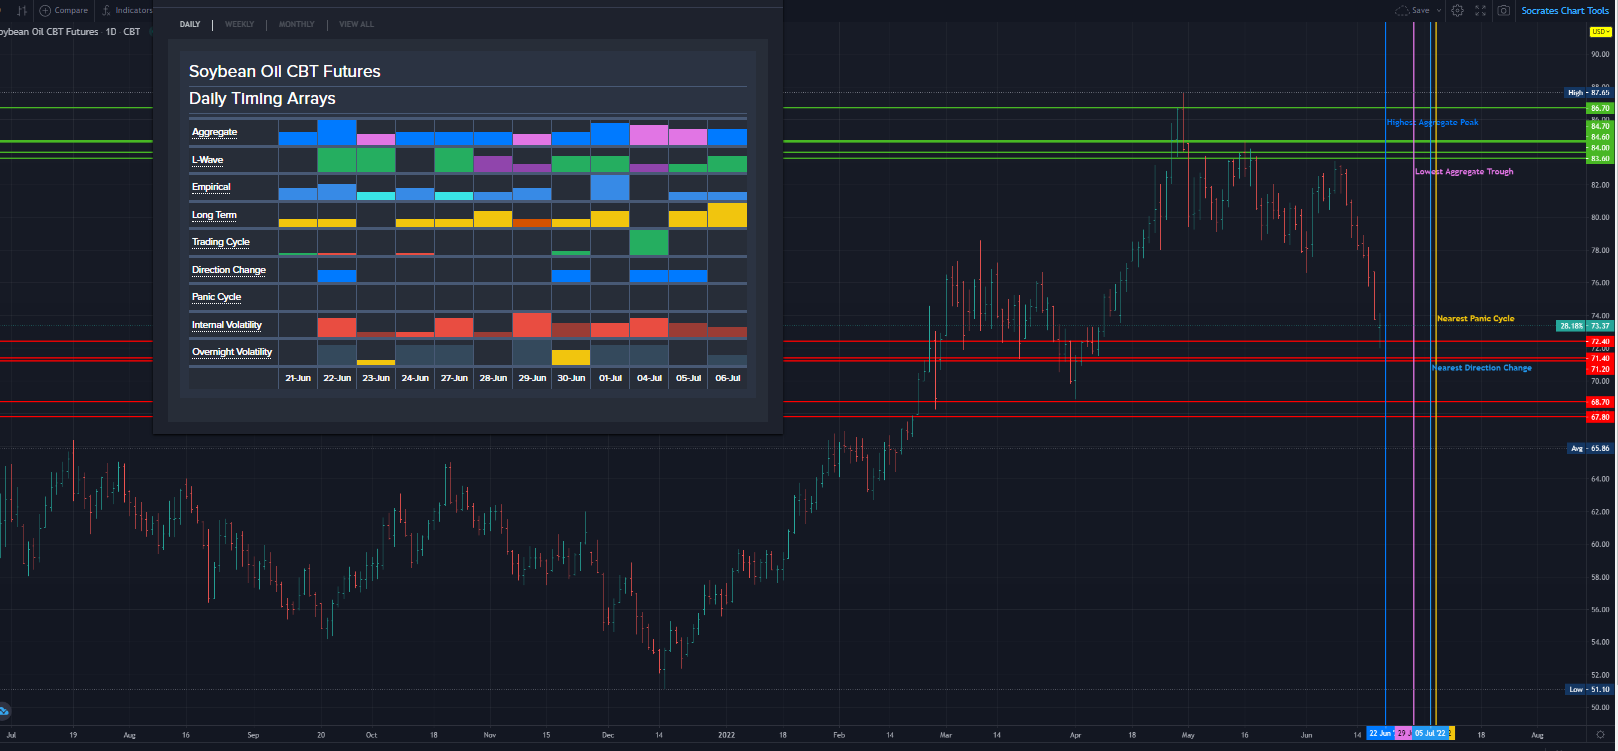
New red pattern on the daily with the weekly pressing lower, the monthly is green with a new pattern forming. You may have a price meets time today with the high aggregate however...should see a reaction today. There is a pretty big bullish trading cycle and a directional change on my birthday which could take a day or two work out to fruition. Remember directional changes can be large moves in the same direction as price is moving.
Chart Text - Daily.
Interestingly, this market opened below the previous low making a new low but just marginally by -∞00% and then closed below that the previous low plunging
significantly in panic mode by 6.15% from the previous session's high. This strongly suggests we are could be entering a potential crash mode position implying caution. A
break of today's low of 7196 during the next trading session will warn of a potentially serious decline ahead especially if it closes below today's low again. The last
important high was formed on Friday April 29th at 8765 which was 37 trading days ago. Our projected support for tomorrow lies at 7163 and a break of that level can set
in motion a continued panic to the downside where extreme support lies at 7069. Hence, pay close attention at this time.
We did close below the previous session's Intraday Crash Mode support indicator at 7230 settling at 0 which alerted us to a further decline was likely going into the instant
session. The Intraday Crash indicator for the next session will be 7069. Now since we closed back above this indicator in the current trading session, then holding above
this indicator for the next session will imply the decline is subsiding. The Secondary Intraday Crash Mode support lies at 6658 which we are trading above at this time. A
breach of this level with a closing below will signal a sharp decline is possible.
Intraday Projected Crash Mode Points
Today...... 0
Previous... 7230
Tomorrow... 7069
This market has declined for 9 trading days since the last high established at 8344 from which we have witnessed a decline of 13%. In the process, we have elected four
Daily Bearish Reversals.
Granted, this decline has penetrated the previous key cycle low established at 7661 and it is sharply lower by 14% from the last high made 06/08. Most importantly, this
market entered Crash Mode 4 days ago. This type of pattern warns we are in the throes of a near-term correction which is rather serious at this moment.
With this decline so far, we have a realistic potential that this may be forming a temporary cycle low. We would need this market to open higher holding above today's
low, then a bounce becomes possible. However, a lower opening implies at lease one more day down.
Presently, the market remains bearish on the short-term levels of our indicators while the long-term trend and cyclical strength are bearish. This market is also trading
above the bank of eight moving average indicators also suggesting it is still above underlying support at this moment. The market is trading within our envelope albeit
skewed to the bearish side.
The Projected Breakout Resistance indicator resides at 7396 which we are already exceeded intraday but the market closed below it as of this session's closing at 7337
Still, this typically implies that this market will rally to test overhead resistance if we exceed that level again intraday.
Intraday Projected Breakout Resistance
Today...... 7668
Previous... 7668
Tomorrow... 7396
Caution is now required for this market is starting to suggest it may rally further.
Messages In This Thread
- Dewey, your bean oil is throwing out a *PIC*