MURICO.com Forum
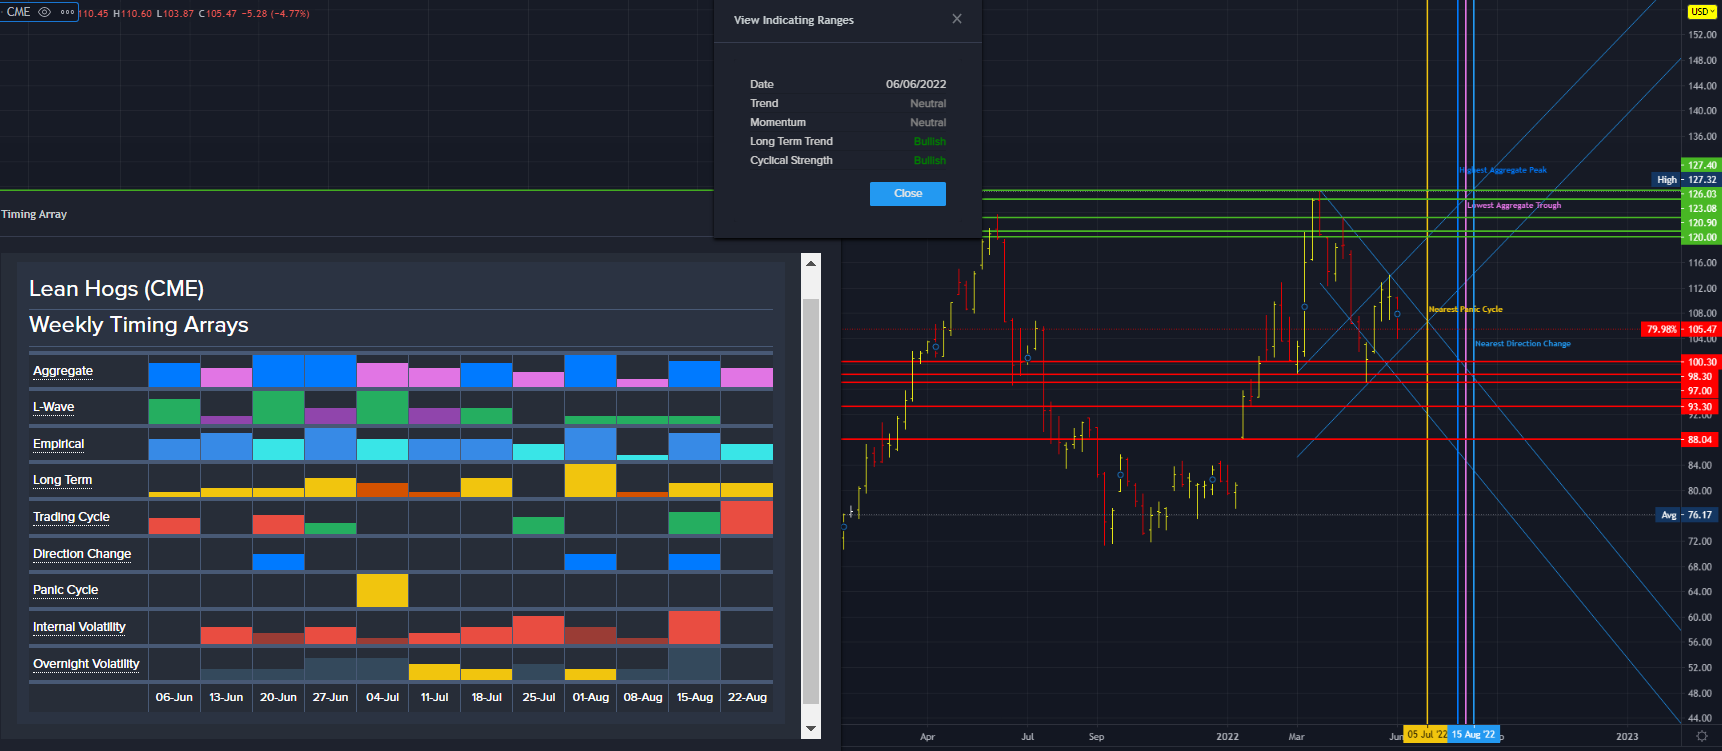
Weekly chart with minor and major reversals...The two nearest major reversals are located at 98.30 and 120.00
Looking at the array...trading cycle seems to be showing a bearish trend in to the week of the 20th where there is a directional change. Best time for a long would be on the 27th, it looks like...maybe even the week of the 20th.
Trading Cycle
The Trading Timing Model offers a union of time and direction that enables the end-user determine when a high or low is likely to occur, but it’s not assured as cycles can be subjected to destructive interference under the superposition principle.
Bullish and bearish markets have empirical nominal durations that last specific time units (days, weeks, months years):
Bullish: 7-11-14-21 time units
Bearish: 2-3-5-6-10-12-18 time units
Bullish trading cycles are measured from a low and Bearish trading cycles are measured from a high. The Trading Cycles model counts the bullish and bearish predictions that fall on a particular time unit. For instance the chart below shows how the cycles are counted (for brevity time units 21 & 18 were ignored)
Time Unit #11 has three cycles that converge; two bullish and one bearish. Since they are of opposite market directions they are indicated by yellow bar.
Below is a sample of how the Trading Cycles data array will appear based on the data above:
Trading Cycles data array