MURICO.com Forum
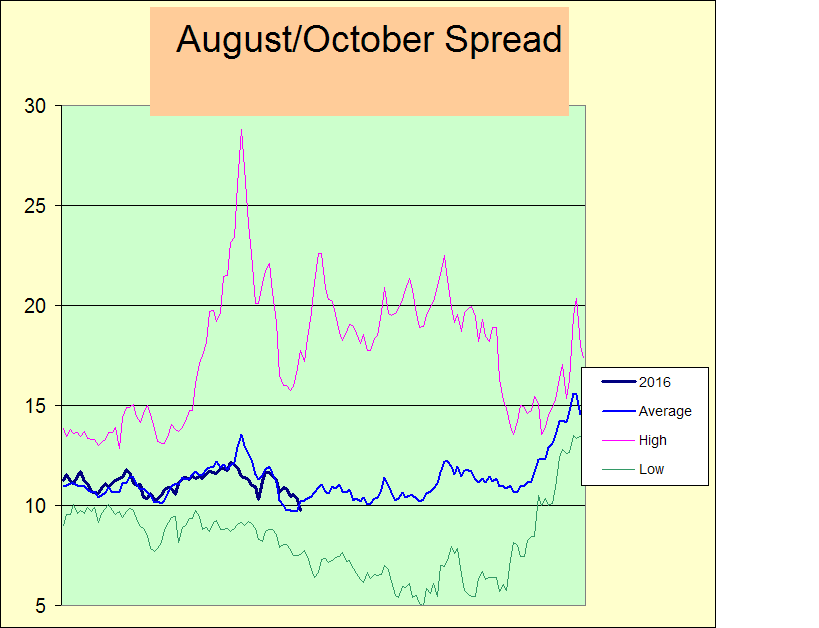
The August/October calendar spread has been giving me somewhat of a draw down so I decided to do a little historical work on the spread's behavior. The chart below is the 5-year average price of the spread from January 1st until the August futures expire on the tenth trading day in August. Besides the average, it show the five-year high, the five-year low and the price for the spread this year up through the close of business last night.
The spread has ranged from a high of 28.825 in 2014 to a low of 5.4 in 2012. On one contract this amounts to a price difference of $9,370.00.
There are a few things that I found interesting about this chart:
1. The price this year is following very closely the 5-year average price.
2. There is a powerful tendency for the price of the spread to go up as it gets close to expiration.
3. From mid-April until mid to late July the average price has tended to be in a fairly stable trading range between 9.75 and 12.50.
Tuesday night it settled at 9.75. Today it settled at 9.925. I'm expecting more bounce in the next few days or weeks. If it dips further, I still have a few open spots on my boat to add a few.
History seems to say that between now and 8/12/16 there will be a fairly strong rally in the Q/V spread and I don't want to miss it.
"When trading hog futures you can always expect the unexpected!" Long Bear
Best wishes,
dhm