MURICO.com Forum
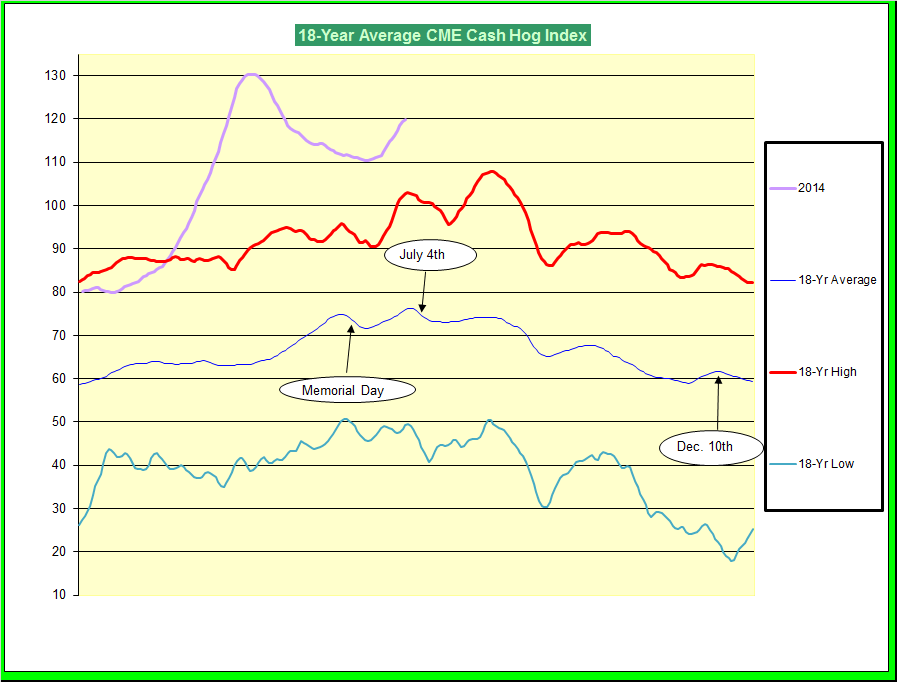
The chart below shows the seasonal annual average price of the CME Lean Hog Index for the past 18-years.
There are some interesting patterns that have a tendency to be repeated year-after-year. There is a strong tendency for the CME Lean Hog Index to go up a week to 10-days in front of Memorial Day, Independence Day and Christmas. This is generally followed by some weakness in the Index.
For some reason there seems to be some strength in the index around the first of October followed by a down trend until about the first of December when the pre-holiday demand begins to pick up.
As you can see, this year we are establishing all-time highs for the CME Lean Hog Index and everyone knows that is because of the PED virus. The surge we are seeing in the CME Index right now fits perfectly with the seasonal tendency for it to go up in front of Independence Day. With the HEN4 trading at a premium of about 8 points over the Index, it would appear that a little weakness in the index could send traders scurrying to exit their long HEN4 positions.
But there is a strong element of uncertainty relative to the supply of market-ready hogs because of the piglet loss last winter. This is probably going to keep the volatility of in the hog market quite high for some time.
Right now I am mostly short Z/G spreads but am standing by and ready to short the NNNs if the index begins to fall.
Best wishes,
Doc
Messages In This Thread
- CME Index Historical *PIC*