MURICO.com Forum
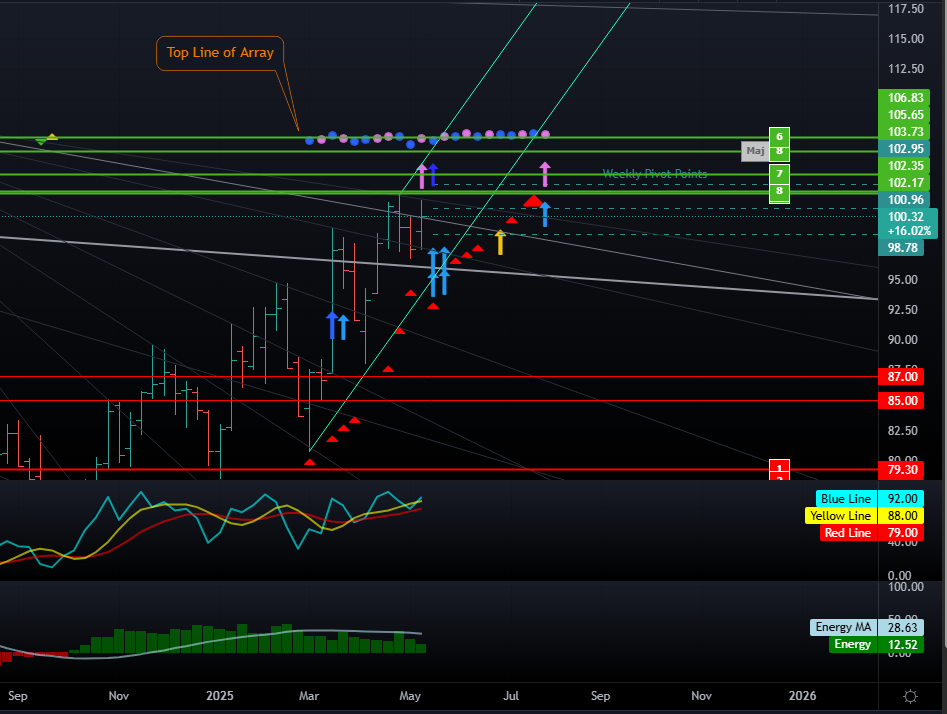
The array is showing a turn date for the week of the 19th, with double directional changes and a trading cycle that is telling us that a low is likely to be established. It did break above the long term trend line for the second time... Looking at the top line of the array, it is showing it will be choppy. There is another double directional change the week of the 27th... A lot of red trading cycles could mean more of the same uptrend action. It looks like the week of the 2nd is going to be the next high aggregate for a turn date to continue trend. We are pretty close to price meeting with time here with those green lines here, so the market will need to close over on a weekly basis above those lines, otherwise we will come down to test support.
Using the speculative model basis, the reversal system is currently hypothetically long 11 positions at this particular moment on the weekly level.
Projected resistance standing at 12253 while support lies at 8700 where any intraday protective sell stop should reside just under that number at this point in time.
The more recent Downtrend Line constructed from the last high of 10197 to the subsequent reaction high of 10160 established this week stands at 10142 while drawing a channel provides us with support at 7874. A break of this support with a closing below it will suggest a correction is unfolding. However, an intraday penetration of this support with a close back above would suggest that market could pause briefly.
WEEKLY OPENING PIVOT NUMBER
On the weekly time level, the number to watch on the opening for the week of May 19th will be 10096. We need an opening print on or below that number to maintain any downward momentum. Our projected underlying support intraday lies at 9616. A break of that level intraday and a closing below that level would warn of a sharp break to the downside is underway. Our extreme projected underlying support intraday lies at 9522. Our projected overhead resistance intraday stands at 10166. A breakthrough above that level intraday and a closing above it would signal a possible sharp rally to the upside is underway.
WEEKLY RISK
Looking at the weekly level, we see a 8.25% risk on the upside, whereas on the downside, the risk factor calculates at 13.2%. From a risk perspective, resistance on a closing basis stands at 10860 whereas the risk on the downside begins at 8700.
Messages In This Thread
- Hogs Weekly *PIC*