MURICO.com Forum
Chart Text - Daily
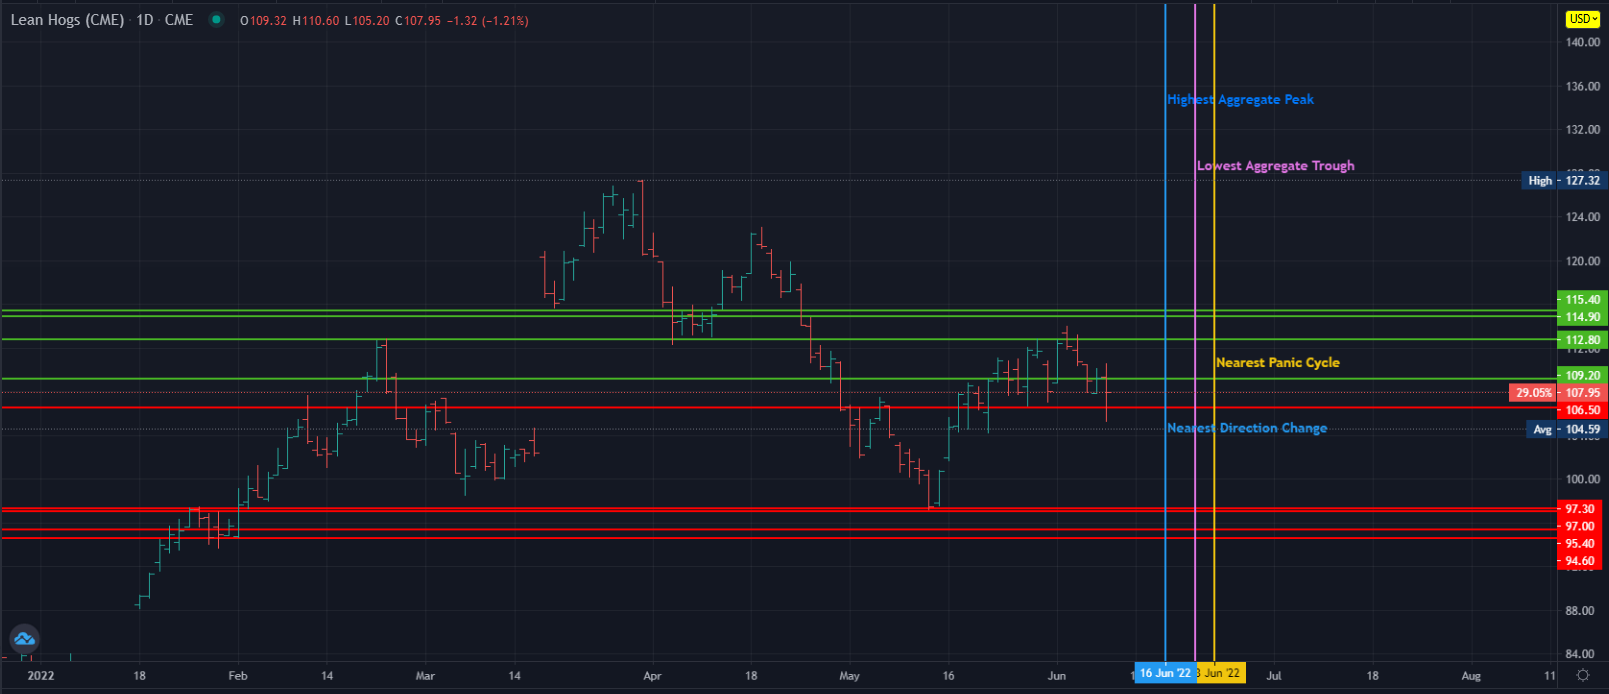
This market made a new high today after the previous trading day. The market opened higher and closed lower making it an outside reversal to the downside as it exceeded the previous high and penetrated the previous low yet closed within that previous trading range. Our projected support for tomorrow's closing lies at 10254. Therefore, this market closed below the opening print while also closing down from the previous closing yet it was holding still for the close, it remains still vulnerable.
Clearly, this market has broken under the former broader cyclical support which now resides above the market at 10971 rendering it vulnerable to a further decline at this time. The market crossed that critical cyclical support three sessions ago confirming a bearish trend and now only a rally back above this level would signal a reversal in the tone of the the market implying a rally ahead.
During the last session, we did close above the previous session's Intraday Crash Mode support indicator which was 10473 settling at 10927. The current Crash Mode support for this session was 10567 which we penetrated intraday but we closed back above that level finishing at 10795 implying the market is still rather vulnerable yet sustaining for now. The Intraday Crash indicator for the next session will be 10300. Now we have been holding above this indicator in the current trading session, and it resides lower for the next session. If the market opens above this number and holds above it intraday, then we are consolidating. Prevailing above this session's low will be important to indicate the market is in fact holding. However, a break of this session's low of 10520 and a closing below that will warn of a continued decline remains possible. The Secondary Intraday Crash Mode support lies at 6460 which we are trading above at this time. A breach of this level with a closing below will signal a sharp decline is possible.
Intraday Projected Crash Mode Points
Today...... 10567
Previous... 10473
Tomorrow... 10300
This market has not closed above the previous cyclical high of 11400. Obviously, it is pushing against this resistance level.
We did close below the previous session's Intraday Projected Breakout Resistance indicator which was 11128 settling at 10927 gesturing that the market is not in a breakout mode at that precise moment. The current Projected Breakout Resistance for this session was 11084which we still closed below. The Projected Breakout Resistance indicator for the next session will be 11131. Now this immediate indicator in the current trading session is above the current close offering projected resistance. Therefore, we either must open above it and hold or close above it to imply the rally is still in play. Otherwise, failure to exceed 11131 during the next session warns the upward momentum may be lost and a retest of support becomes possible.
Intraday Projected Breakout Resistance
Today...... 11084
Previous... 11128
Tomorrow... 11131
